1
2
3
4
5
6
7
8
9
10
11
12
13
14
15
16
17
18
19
20
21
22
23
24
25
26
27
28
29
30
31
32
33
34
35
36
37
38
39
40
41
42
43
44
45
46
47
48
49
50
51
52
53
54
55
56
57
58
59
60
61
62
63
64
65
66
67
68
69
70
71
72
73
74
75
76
77
78
79
80
81
82
83
84
| import matplotlib.pyplot as plt
import numpy as np
import pandas as pd
import warnings
warnings.filterwarnings("ignore")
plt.rcParams["font.sans-serif"] = ["SimHei"]
plt.rcParams["axes.unicode_minus"] = False
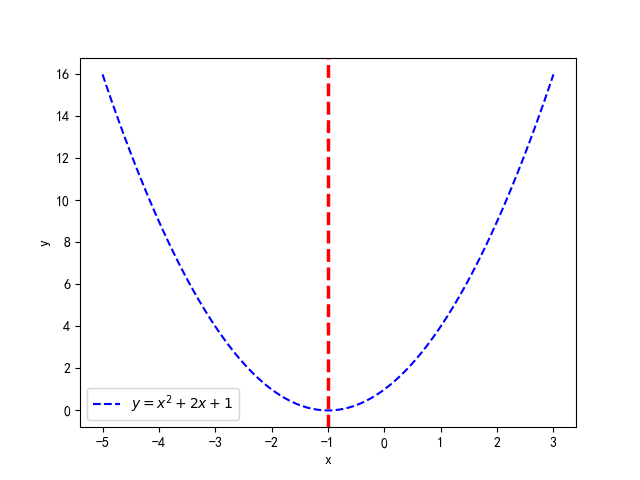
x = np.linspace(-5, 3, 100)
y = x**2 + 2 * x + 1
plt.plot(x, y, "b--", label="$y=x^{2}+2x+1$")
plt.axvline(x=-1, color="r", linestyle="--", linewidth=2.5)
plt.xlabel("x")
plt.ylabel("y")
plt.legend()
plt.show()
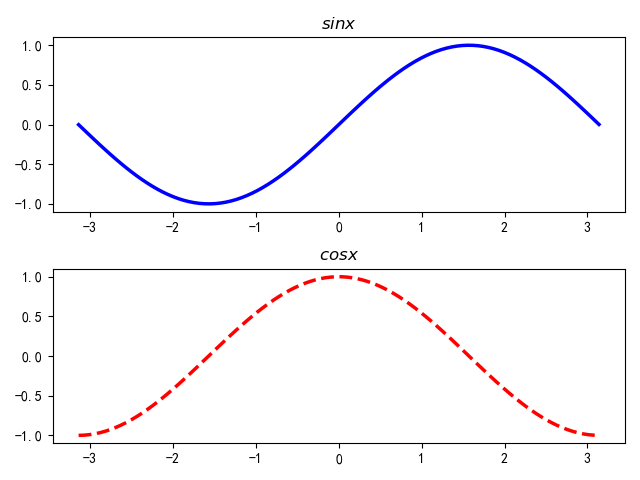
x = np.linspace(-3.14, 3.14, 100)
y1 = np.sin(x)
y2 = np.cos(x)
plt.subplot(2, 1, 1)
plt.plot(x, y1, "b", linewidth=2.5)
plt.title("$sinx$")
plt.subplot(2, 1, 2)
plt.plot(x, y2, "r--", linewidth=2.5)
plt.title("$cosx$")
plt.tight_layout()
plt.show()
df = pd.read_excel("酒店数据2.xlsx", index_col=0)
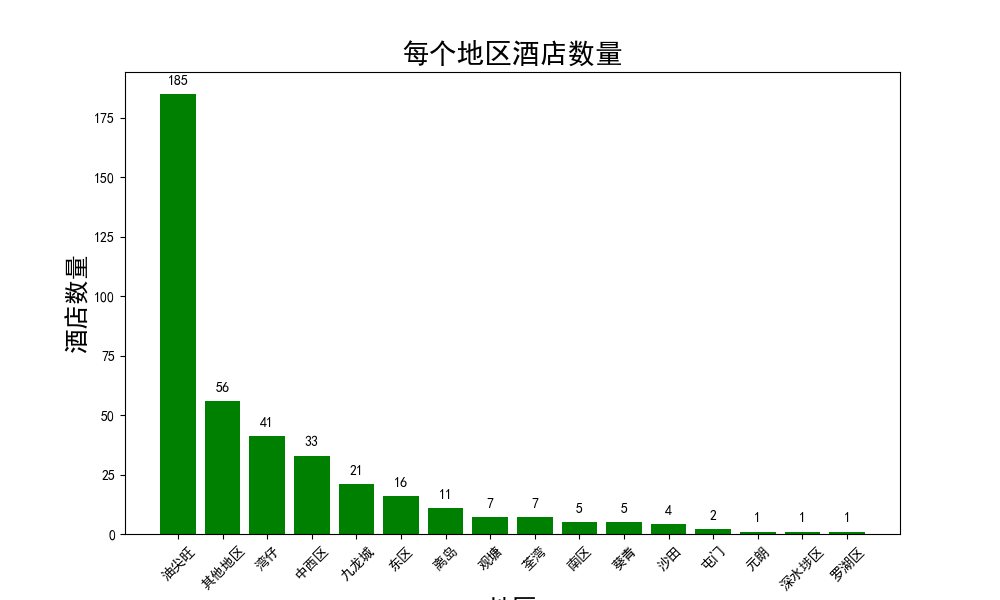
data = df["地区"].value_counts()
x = data.index
y = data.values
plt.figure(figsize=(10, 6))
plt.bar(x, y, color="g")
plt.title("每个地区酒店数量", fontsize=20)
plt.xlabel("地区", fontsize=18)
plt.ylabel("酒店数量", fontsize=18)
plt.xticks(rotation=45)
for a, b in zip(x, y):
plt.text(a, b + 3, b, ha="center", va="bottom", fontsize=10)
plt.show()
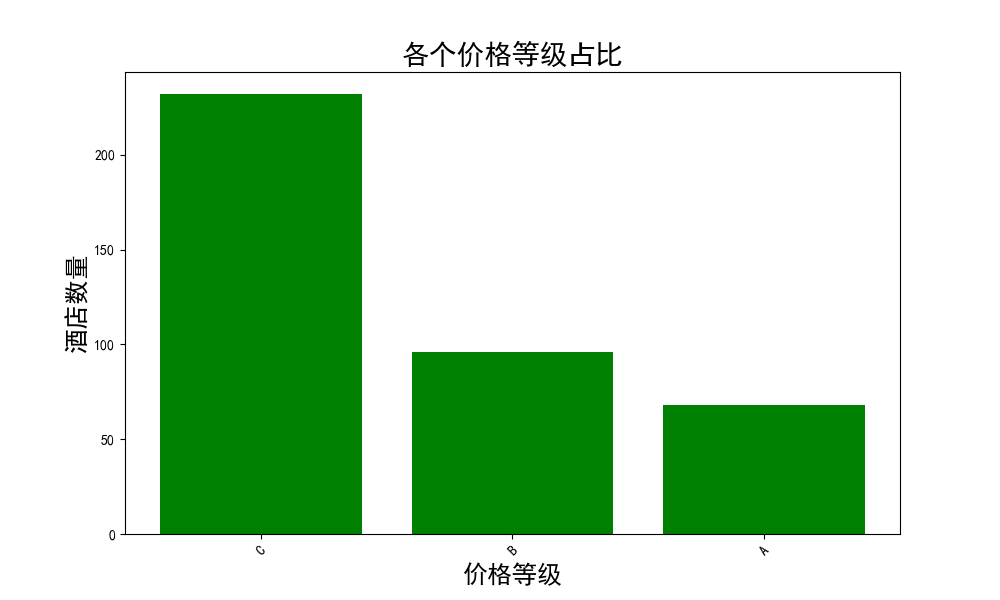
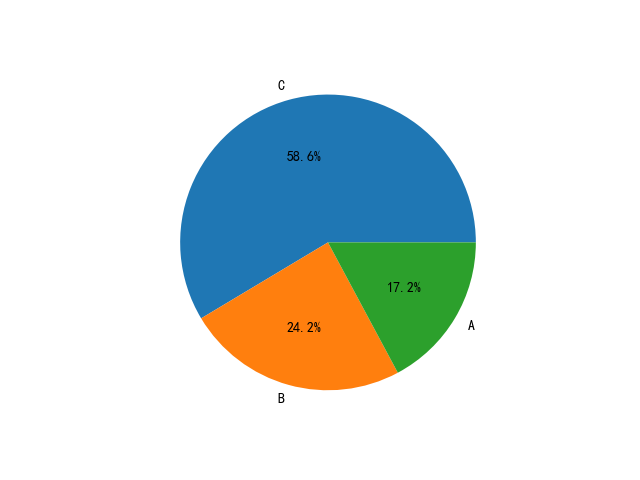
data2 = df["等级"].value_counts()
x = data2.index
y = data2.values
plt.figure(figsize=(10, 6))
plt.bar(x, y, color="g")
plt.title("各个价格等级占比", fontsize=20)
plt.xlabel("价格等级", fontsize=18)
plt.ylabel("酒店数量", fontsize=18)
plt.xticks(rotation=45)
plt.show()
plt.pie(y, labels=x, autopct="%1.1f%%")
plt.show()
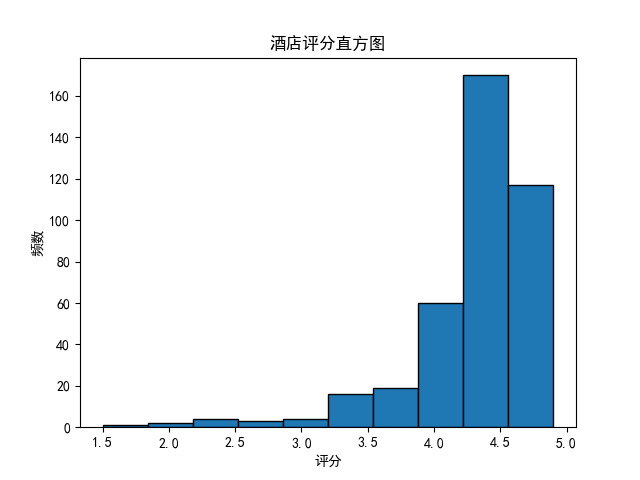
plt.hist(df["评分"], bins=10, edgecolor="black")
plt.title("酒店评分直方图")
plt.xlabel("评分")
plt.ylabel("频数")
plt.show()
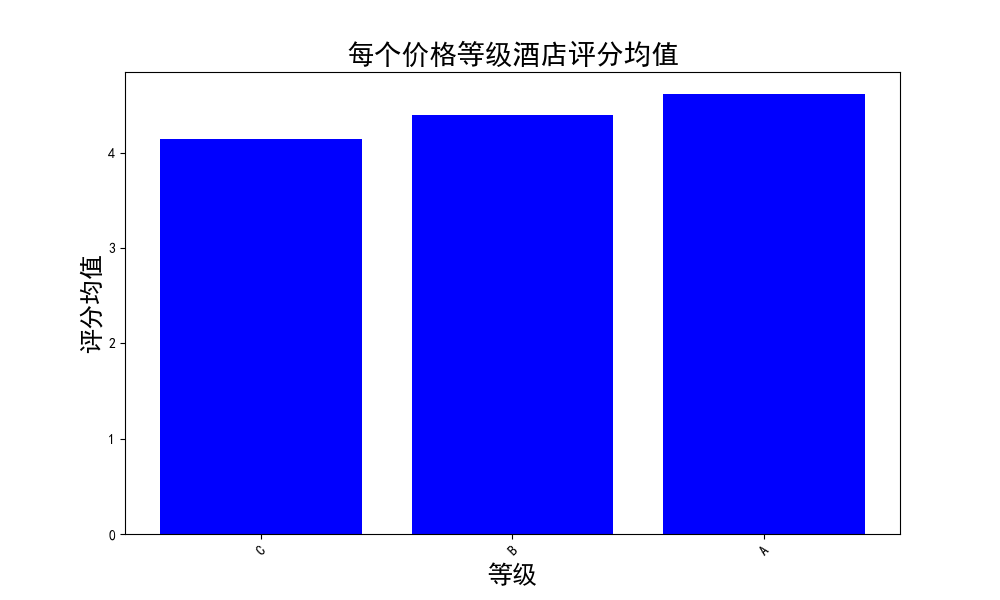
df["评分均值"] = df.groupby("等级")["评分"].transform("mean")
sorted_df = df[["等级", "评分均值"]].drop_duplicates().sort_values(by="评分均值")
plt.figure(figsize=(10, 6))
plt.bar(sorted_df["等级"], sorted_df["评分均值"], color="b")
plt.title("每个价格等级酒店评分均值", fontsize=20)
plt.xlabel("等级", fontsize=18)
plt.ylabel("评分均值", fontsize=18)
plt.xticks(rotation=45)
plt.show()
|

